|
|
|
|
|
|
|
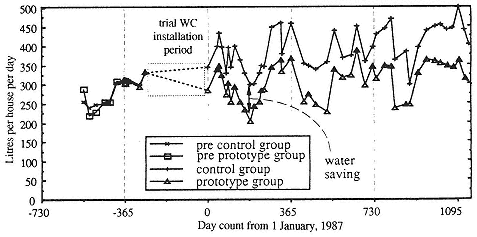
Figure 13.9
Comparison of prototype 4-litre flush w.c. housing group's water consumption relative
to a control group's over a 3 year period. Also note pre-installation water
consumption is sensibly identical for both groups |
|
|
|
|
|
|
|
|
September 1987 and thereafter at 1 month intervals to January 1990. An adjacent control sample of 30 identical houses with 10litre WCs was also monitored. The prototype group were found to use a mean of 2.4 kilolitres less per house per month than the control group, or a difference of 19 litres per caput per day. In terms of percentage savings, the prototype houses used 1630 per cent less water than the control group during December 1986 to January 1990. Figure 13.9 shows consistent seasonal water savings and also illustrates that the water consumption for the prototype and control groups prior to the installation of the trial WCs was sensibly identical over the 12-month period from February 1985. |
|
|
|
|
|
|
|
|
Additional water data collected to determine the percentage of household water that was used for WC flushing indicated that the prototype group used 21 per cent and the control sample used 40 per cent for this purpose. This result may be used to predict the savings possible for a range of flush volumes. From a knowledge of the total water use during any period in both prototype and control group dwellings, and the appropriate percentage used for WC flushing, the non-WC usage may be determined. The number of WC operations for the prototype WC is also known from its flush volume, thus the hypothetical |
|
|
|
|
|