|
|
|
|
|
|
|
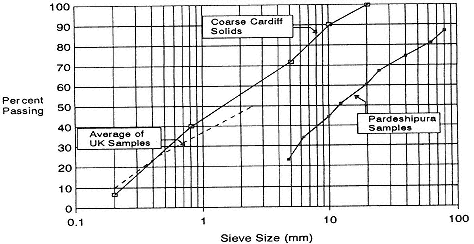
Figure 14.2
Comparison of drain solids size distributions |
|
|
|
|
|
|
|
|
The averaged results of this analysis are shown in Figure 14.2, in comparison with results from averages of UK sewer sediment studies, and a curve describing a coarse sediment sample from Cardiff (Binnie et al., 1987). The Indore curve is significantly to the right of the UK closed conduit sewer sediment data. This shows that the drain solids in Indore contain more large material; compare the Indore d50 of 12.5 mm with the d50 of 2.43 mm found as a mean of UK sediment studies (Binnie et al., 1987). Indeed, more than 10 per cent by mass of the Indore drain solids are larger than 80 mm. The application of sediment transport theory to sewer design is still in its infancy (Ackers et al., 1994). It is, however, very likely that material of the size described here will require higher self-cleansing velocities than can be attained in typical open drains. |
|
|
|
|
|
|
|
|
14.2.4
Hydrological Measurement and Modelling |
|
|
|
|
|
|
|
|
Rainfall and Runoff Measurement |
|
|
|
|
|
|
|
|
Rainfall was measured by a Montec Detectronics recording raingauge (0.2 mm tipping bucket size) at 2 minute intervals. Data were collected between 25 July and 15 September during the monsoon of 1994; during this gauging period, a total of nearly |
|
|
|
|
|