|
|
|
|
|
|
|
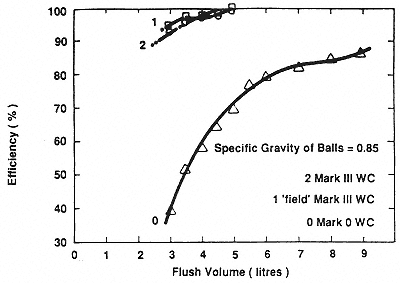
Figure 13.3
A comparison between the multiple ball efficiencies obtained by
the Mark 0, Mark III and 'field' Mark III WCs |
|
|
|
|
|
|
|
|
performed better than the original (Mark 0) Twyfords WC flushing with 9 litres. Figure 13.4 presents the results of the liquid contamination test, with a lower residual concentration for the Mark III WCs at 3 litres than the Mark 0 WC at 9 litres. The Mark III WCs only required 2 litres to pass the BS5503 paper and ball tests, but required 3.5 litres to pass the BS5503 sawdust test. |
|
|
|
|
|
|
|
|
Results from the solid transportation tests are shown in Figure 13.5, presented as solid velocity along the drain, set at a gradient G at distance L from the WC drain connection, plotted as Ö(L/G), providing a linear characteristic (Swaffield and Wakelin, 1976). Figure 13.5 indicates that a flush volume of 3 litres should only be adopted for drain lengths up to 11.25 m at a gradient of 1 in 80 prior to inflow connection from other sanitary appliances. Most on-site sewage disposal or storage systems would meet this restriction. For drains connected to a main sewer, a minimum flush volume of 4 litres was recommended to achieve similar solid transportation performance to the Mark 0 WC flushed with 9 litres. These flush volumes were adopted for the site trials. |
|
|
|
|
|
|
|
|
These results confirmed Uujamhan's (1981) functional relationship (equation 13.1 and Figure 13.2) for solid and fluid contamination removal. From Figure 13.2 the value of the dimensionless |
|
|
|
|
|